|
|
|
Know your Place
Old maps can help us visualise where and how our ancestors lived
as Roy and Lesley Adkins explain
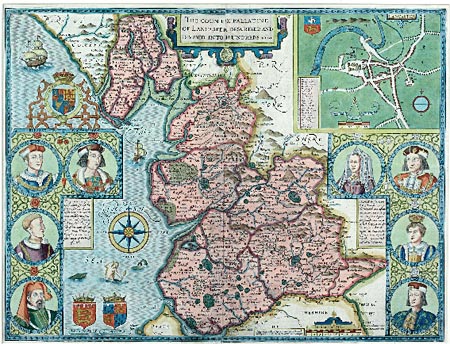 Many of the earlier British maps portray an entire county.
Before the era of photography, a map may be the only visual clue to a forebear's life and times. While Know your place Old maps can help us visualise where and how our ancestors lived, as Roy and Lesley Adkins explain modern maps are always handy for quick reference, contemporary or near-contemporary maps are much more useful for really appreciating the area to which a member of your family belonged.
Maps literally come in all shapes and sizes, and in the November 2009 issue of FHM Karen Foy described the technical work of the mapmaker from earliest times in Britain. Although they were used by the Romans, the earliest maps a family historian is likely to come across are from the 16th century. As a rule of thumb, the earlier the map, the less informative and less accurate it will be - but like any rule, there are exceptions.
All change
Many of the earlier British maps portray an entire county, while others record the roads between major towns and cities. Even though the detail on these maps is minimal, it is fascinating to compare them with modern maps and see the changes in the landscape. An early 18thcentury map by John Senex of the route from King's Lynn to Great Yarmouth is divided into six strips. The end strip shows the road from Haddiscoe (spelled Hadske) to Yarmouth.
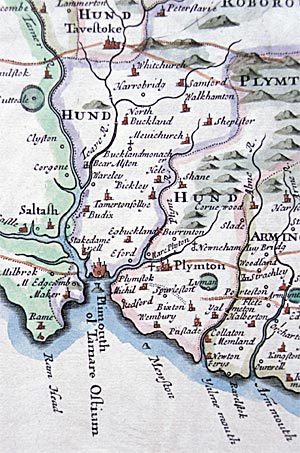 Detail from a county map of Devon by Robert Morden 1695.
In the countryside from at least the 16th century, estate maps were produced for the major landowners in the parish, usually to supplement a written survey. Since each of these maps was an individual, hand-drawn commission rather than massproduced prints for sale to the public, they vary widely in scale, accuracy and detail. In some regions they may be the only large-scale map to pre-date the tithe maps.
Similar to estate maps, enclosure maps are invaluable visual records of substantial changes in the landscape. From around 1750, the often controversial enclosure of millions of acres of communally-farmed open fields took place, as well as the enclosure of commons and wasteland. This was done by obtaining approval for the enclosure through over 5,000 individual Acts of Parliament. From 1801, general public enclosure acts were passed in order to simplify proceedings.
If an enclosure was approved, commissioners were appointed, and the area was then surveyed, before reallocating larger blocks of land to landowners, which did away with the piecemeal, scattered landholdings. The final decisions were written down in the 'Enclosure Award', and this was accompanied by an updated enclosure map. These maps show the newly created fields, the old roads, the new straight roads and other features like quarries, limekilns, farms, windmills, watermills and churches. Unfortunately, the more interesting 'before' maps do not survive in nearly the same quantities as the 'after' maps.
Paying your dues
The system of tithes - the payment to the Church by the lay population of one-tenth of all produce, including crops and animals - dates back to Saxon times. In Scotland tithes were abolished during the Reformation, and many areas in England and Wales had changed to payments in cash rather than in kind by the early 19th century. In many enclosure awards, the Church was given a one-off allotment of land instead of tithes being paid year-by-year. The Tithe Commutation Act of 1836 set out to get rid of anomalies, to ensure fairness and to commute or convert the remaining tithes into cash payments.
Surveys were conducted of those areas where tithe payments were still being made, and the result was a series of what are known as 'tithe maps'. The accompanying survey documents are called 'tithe apportionments', and these are effectively a key to the maps. They give the names of owners and occupiers of properties, as well as other information such as the state of cultivation and rent charges.
Since many of these maps were made just before or after the census of 1841, they are a particularly productive tool for finding out where, and to some extent how, an ancestor lived. The Tithe Award for Donyatt in Somerset, for instance, includes the information that the owner of plots 97 and 98, known evocatively as Yonder Soggey Plot and Hither Soggey Plot, was Richard Thomas Coombe, the occupier was James Colman, and the land was used as pasture.
Tithe maps vary from parish to parish, and some were much better mapped than others, a real treasure chest of local and family history. Copies of the maps are kept by The National Archives, but most record offices have microfiche versions for their locality, if not the original maps themselves. Roughly three-quarters of the area of England and Wales are covered by tithe maps, but in some counties where a great deal of enclosure had taken place before 1836, there are relatively few.
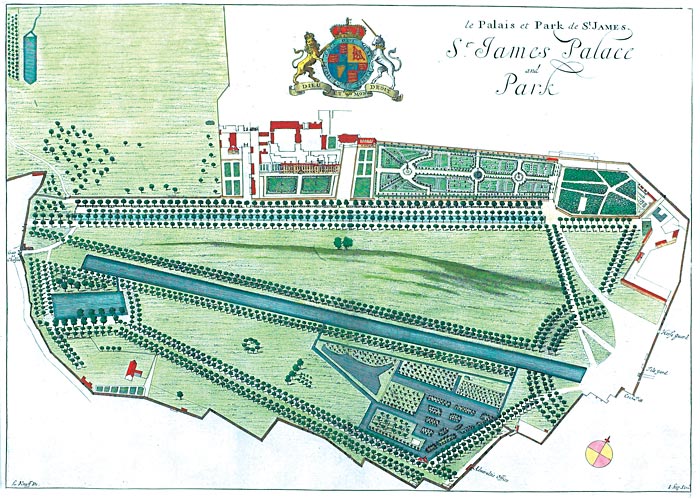 Some early maps focus on a relatively small area. Ordnance Survey maps
Another essential resource for the family historian is the Ordnance Survey map. As the name ordnance suggests, these maps have a military origin. They began as a military survey of the southern counties of England, so that defence preparations could be made against a feared invasion from France. Begun in the 1790s, the first map was of Kent, and this was privately published in 1801.
After the end of the Napoleonic Wars in 1815, the Ordnance Survey continued with the aim of producing a series of non-military maps at a scale of one inch to one mile (where one inch on the map represents one mile - which has 63,360 inches - on the ground). This first series of one-inch maps was not completed until 1873, by which time the earlier ones were already out of date and a second series had been started during the 1840s. Further series and updates followed during the 20th century, culminating in the present range of Ordnance Survey maps, with their distinctive purple covers, which are produced in a metric scale (1:50,000, equivalent to one and a quarter inches to one mile).
The first edition maps have been reproduced as facsimiles by several commercial companies, but must be used with caution because later features, such as railway lines, have at times been added. Again, local record offices usually have the relevant maps in some form. From the later 19th century the Ordnance Survey branched out into producing maps at larger scales and sixinch to the mile and 25-inch to the mile scale maps began to be published. These are invaluable for what they show in both rural and urban areas. The detailed maps that most people (especially walkers) buy today are 1:25,000 in scale, equivalent to two and half inches to a mile, which is a far cry from those 25- inch maps. Ordnance Survey maps provide an accurate, visual record of the development of the landscape through the 19th and 20th centuries, the period of most family history research.
All-purpose maps
From the 18th century the building of canals and then the railways led to surveys of the proposed routes, but later railway maps are often based on existing Ordnance Survey maps. In towns, intricate maps were created for various reasons. For example, following the Public Health Act of 1848, some urban areas undertook maps at a very large scale, such as 24 inches to the mile, and some were as massive as 120 inches to the mile.
These particular maps were commissioned and used by local authorities, but a range of maps was made of towns and cities for all kinds of commercial and private reasons. Social researchers such as Henry Mayhew and Charles Booth compiled 'poverty' maps of urban areas, mainly London, while cholera maps, published in the 1830s, recorded the incidence of that disease.
Insurance companies began producing town maps as early as the 18th century in order to help them calculate the risk of fire in built-up areas and set their premiums accordingly. Fire insurance maps of the 19th century can be especially detailed, and maps and plans produced by urban developers at this date are also worth having a look at.
For the 20th century, maps were produced by the Valuation Survey Office. Nicknamed 'the Lloyd George Domesday', the Valuation Survey was conducted between 1910 and 1915. The point of the survey was to assess the level of Incremental Levy Duty that was payable on a property when it was sold. The idea behind this tax was that when a property was sold, the resulting profit was partly due to the public amenities the property enjoyed, such as roads and drainage. The tax was withdrawn in 1920, but the survey records contain details of each property, with a list of owners and tenants, as well as maps and plans.
Also for the 20th century, street maps of towns and cities were frequently published, although most were made for the larger urban centres. Maps of towns and cities can also be found in local history books of the time and in publications by the Automobile Association and the Royal Automobile Club, as well as in tourist guides to Britain, such as the Baedeker series.
Finding your way
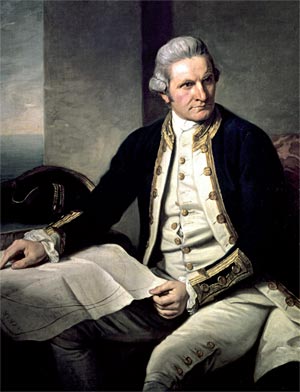 Maps have long been integral to our way of life. James Cook would have relied heavily on them. While most local record offices have map collections, not all their maps are likely to have been separated out from other documents, and some lateral thinking is required to find the most obscure maps. These might be attached to such records as applications to move a footpath or right of way, documents and catalogues relating to the sale of a parcel of land or a whole estate, or an architect's plans attached to records of farms and cottages rented out by a large landowner. It is always worthwhile searching the indexes of paper records as well as the maps for an area you are interested in - you never know where you might find yourself.
Once you have tracked down relevant maps, it is a case of interpreting them, since maps need careful reading to get the most out of them. For early maps especially, it may be difficult to find your way around, or even recognise the area at all, because different map makers had different priorities and because the landscape may have altered so much.
Maps that were compiled for specific purposes do not always portray every detail on the ground, only what was needed. And just because a house or even a village is not shown on a map does not prove it was not in existence at that time. It is always prudent to compare as many maps as possible.
For some maps, the convention of 'north at the top' was not followed, which may add to the difficulty of locating exactly where you want to be on the map. Ordnance Survey maps are very useful because their accuracy can be relied upon - errors in Ordnance Survey maps are rare, so it can help to try to correlate an early map with the same area on an Ordnance Survey map, using structures that occur on both.
Churches and bridges are good for this, as they will probably not have moved. Other features such as roads may well have changed, while railway lines might have been depicted before being fully built, with part of the route altered later on.
Some parts of a map might also be more accurate than others, because surveyors would cut corners by filling in parts of the map from an earlier one and only doing a new survey to update changes or add various details.
Uphill and downhill
Once you have pinpointed the place where an ancestor lived, the next step is to assess the surrounding area. Cars have been widely used for less than 100 years. Before transport such as cars, trains, bicycles and buses, people rode horses or used horse-drawn transport like carts and carriages, while the majority travelled on foot. Certainly, most people walked to work or school each day, sometimes as much as 10 miles or more each way, and so the terrain around where they lived was of great importance, which you can try to understand from maps.
For regular journeys they would have avoided obstacles such as steep hills, marshland and unbridged rivers. In this way, reading the map can give an insight into their daily lives. If an early map does not have contours or other indications of the topography, you need to correlate it with an Ordnance Survey map. Modern OS maps have contour lines, which give the height of the land. The closer together the contour lines, the steeper the land. Earlier OS maps depict hills and mountains with shading.
 You may have found a wonderful verbal description of the place where an ancestor lived or worked, but a map can instantly bring that portrayal to life. The landscape would also have a bearing on which church or chapel was attended on Sundays. In theory they were supposed to worship at their parish church, but that might not be the nearest one, or the easiest one to walk to, and these rules were frequently broken. Making a good guess as to which church they actually attended can save a great deal of time if you are looking up church records or searching the churchyard for family graves.
Other features might also have a bearing on their lives, even down to weather conditions. Was the place where they lived isolated? In a town or village? Was it exposed to the wind? On a main road or coaching route? Where was the nearest market town? All these things would have an influence on their daily routine, so as well as helping to identify where an ancestor lived, maps also provide clues to their lifestyle. It is always essential to consider a wide area, and not just focus solely on the place itself.
Maps are also important for establishing which parish your ancestor lived in. This was important to them because the parish authorities had great control over their lives, collecting tithes and other taxes, and doling out poor relief. For the family historian, finding out the right parish is an essential first step before searching the local records.
You also need to be absolutely certain that you have found the correct place for your ancestor, because place names are frequently duplicated in different parts of the country or even within the same county. The names Aston and Broughton, for instance, are scattered across many counties. And as is clear from some maps, the spelling of place names can change. On the 1720 map of the route between Exeter and Chideock, almost every place name has a curious spelling, such as Chidiok for Chideock, Collaton for Colyton, Cullyford for Colyford and Lime for Lyme (which later became Lyme Regis). This is a reminder when searching any document that 'correct' spelling did not always exist!
The range of available maps depends in part on what maps have survived. With obscure maps and one-off maps, such as estate maps, their survival is down purely to chance. Some areas have many more maps, and London in particular is covered by a great many maps of all dates and sizes while some rural areas have very few. Whatever the area, maps are essential tools for the family historian. All too often they are used merely to locate a place name found in written records, yet maps can provide so much more information and even throw up new routes for research.
By Roy and Lesley Adkins
Courtesy of Family History Monthly
Cassinimaps has a collection of 16th, 17th and 18th maps from Cassini's British Library collection. |